Data Sciences
Innovative methods for analysing non-assembled data
Date:
Date:
Changed on 14/03/2023
It’s something of a paradox. Machine learning has seen data analysis become unbelievably powerful and highly automated. But before they can do anything, analysts first have to bring the data together themselves, a task they spend on average more than 60% of their time on.
Data often comes from different tables, meaning it first has to be brought together into one single table. As Alexis Cvetkov-Iliev explains, “The data in these tables comes in lines and columns. Bringing them together involves two basic operations: union for adding lines, and join for adding columns. But each of these operations presents its own challenges.”
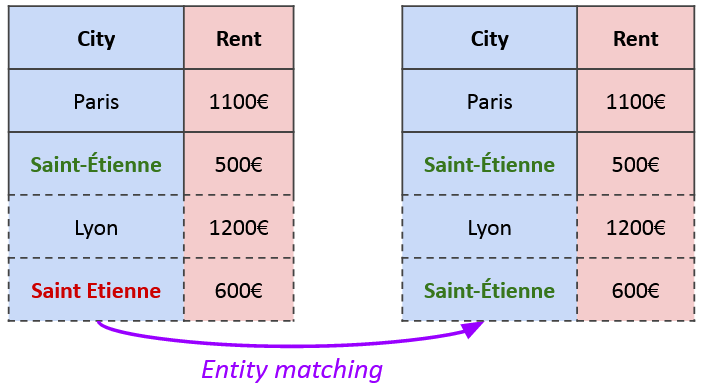
The first involves what is known as entity matching. “Imagine I’m looking at the cost of rent in different cities in France. I already have several lines for Paris, others for Lyon, and now I want to add Saint-Étienne. But when I go to get the data from different tables, I see that the city is sometimes spelt ‘Saint-Étienne’ and sometimes ‘Saint Etienne’, without the accent and without the hyphen. As a result, they are seen as being two different cities, which is obviously going to skew the results. What you need to do is to bring the two together manually so that the spelling is the same.”
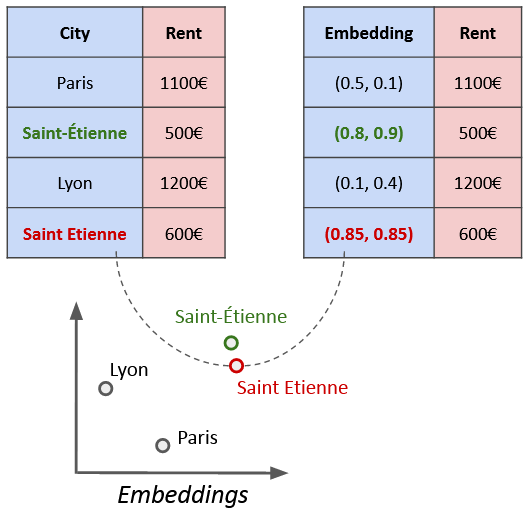
Research carried out during the PhD arrived at a solution involving the use of ‘embeddings’, vectorial representations which encode information on entities. Each city is represented using a vector, which is a set of coordinates. There is a structure behind this, entities with similar characteristics being close together in space.
This is where things start to get interesting. Through the use of suitable embeddings, ‘Saint-Étienne’ and ‘Saint Etienne’ came to be represented by very similar vectors: (0.8, 0.9) and (0.8, 0.85), removing the need for any manual clean-up involving adding accents or hyphens. The embeddings themselves are then used in the analysis. “If my two points are close enough together, then I consider them as being essentially the same. In terms of the analysis behind it, we have shown that this has basically no impact on quality. In fact, it's actually much quicker.” This led to an article being published in the journal IEEE Access.
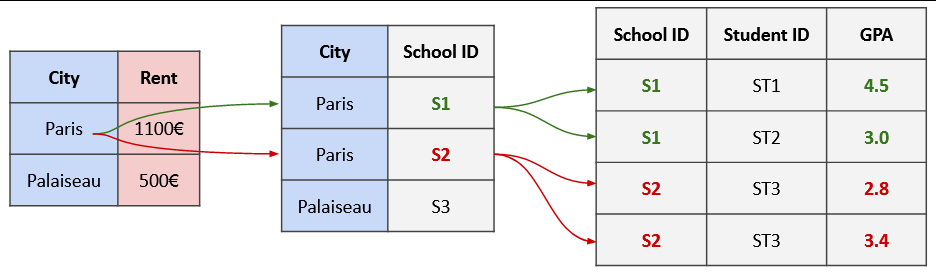
The second problem was joins. When you want to add a new column to a table, there needs to be a one-to-one relationship between entities and the values you are looking to add. This is a prerequisite for joins. “If we look at our cities again, I have just one population value for Paris: 2.2 million. But this doesn't work if I want to add Parisians’ salaries, as they all get paid differently. This creates a “one-to-several” relationship between the entities (the cities) and the values (people's salaries), but in my column I can only put one value.”
The solution is to manually aggregate all of the values to produce just one indicator, by calculating the mean salary, the median salary or the total of all of the salaries combined. The choice of indicator will depend on the analysis.
But in practice things get even more complicated. “Let’s imagine now that I want to explore the standard of education in Paris. The city has multiple schools, and each has multiple students, meaning I will need to combine the grades of pupils in each school and then the grades from all schools. This means I have two data aggregation stages. And for each stage, all sorts of different indicators are possible, from average grades to quantiles and so on”.
Here too, the new method devised by Alexis Cvetkov-Iliev involves the use of embeddings. For each entity (in this case each city), the scientist calculates a vectorial representation containing all of the information found in the initial tables, such as population, region of origin, regional poverty rates and so on. As a result, each entity is now described using just its vector, giving you a one-to-one relationship and making it much easier to create joins.
Methods for automated data aggregation with vectorial representation had been developed before, but these methods calculated all possible combinations of indicators, retaining a great deal of redundant information. Vectors are large, take up a lot of memory and require a significant amount of processing time. For the same calculation, a vector which previously would have had more than 100,000 numbers now has no more than 200. This new method offers more compact syntax. “In terms of quality of performance you don't see any difference.”
Before getting down to the embedding, Alexis converts tables into graphs, a relatively simple way of representing information. He links two entities via a relation to form a triplet, e.g. “Paris, capital of, France”. The advantage of this is that it makes it easy to combine information from very different sources. “Everything is brought together in one graph. This is the whole point of data science: to have data that can easily be interconnected.”
This research has brought about another significant improvement. “Embedding was widely used in the past in language, including for the famous ChatGPT. But in that field, the entities are words. Using a large text corpus, the model learns one embedding for each word. By the end, this representation will contain the meaning of the word, while the vectors for two similar words will be close to each other.”
Older methods are not compatible with digital data, which is continuous. They calculate an embedding for each digital value independently, but they don’t preserve their underlying structures. “You would assume that the vectors for two similar values would be close to each other. But with older methods there’s no specific constraint for ensuring this, leading to poor quality embeddings.”
To rectify this, analysts often employ what is known as ‘binning’, which involves forming groups of values. You might have one group from 1 to 10,000 inhabitants, and another from 10,000 to 100,000 inhabitants. At the end, values from the same group will have the same embedding. The disadvantage of this is that a town with a population of 10,000 will end up in the same group as a village with a population of 100, but in a different group from a town with a population of 10,001.
And so it’s back to square one: one vector for 10,000 inhabitants and another for 10,001, but these may be very different. This is where the key innovation comes in. With this new method, the embedding for a given digital value will be a linear combination of two embeddings. “How I combine them and the weight I give to each of them will depend on the value in question. For the population of a village with 100 people, this will be 99% of embedding n°1 and 1% of embedding n°2. For a big city with 2 million people, it will be the opposite: 1% and 99%. As the population increases, more and more weight is given to embedding n°2. In the end, two similar values mix the two embeddings together in similar proportions, delivering similar vectors. This method works well in practise and is relatively cheap as you only need two embeddings for all of the population values, instead of needing one embedding for each value.”
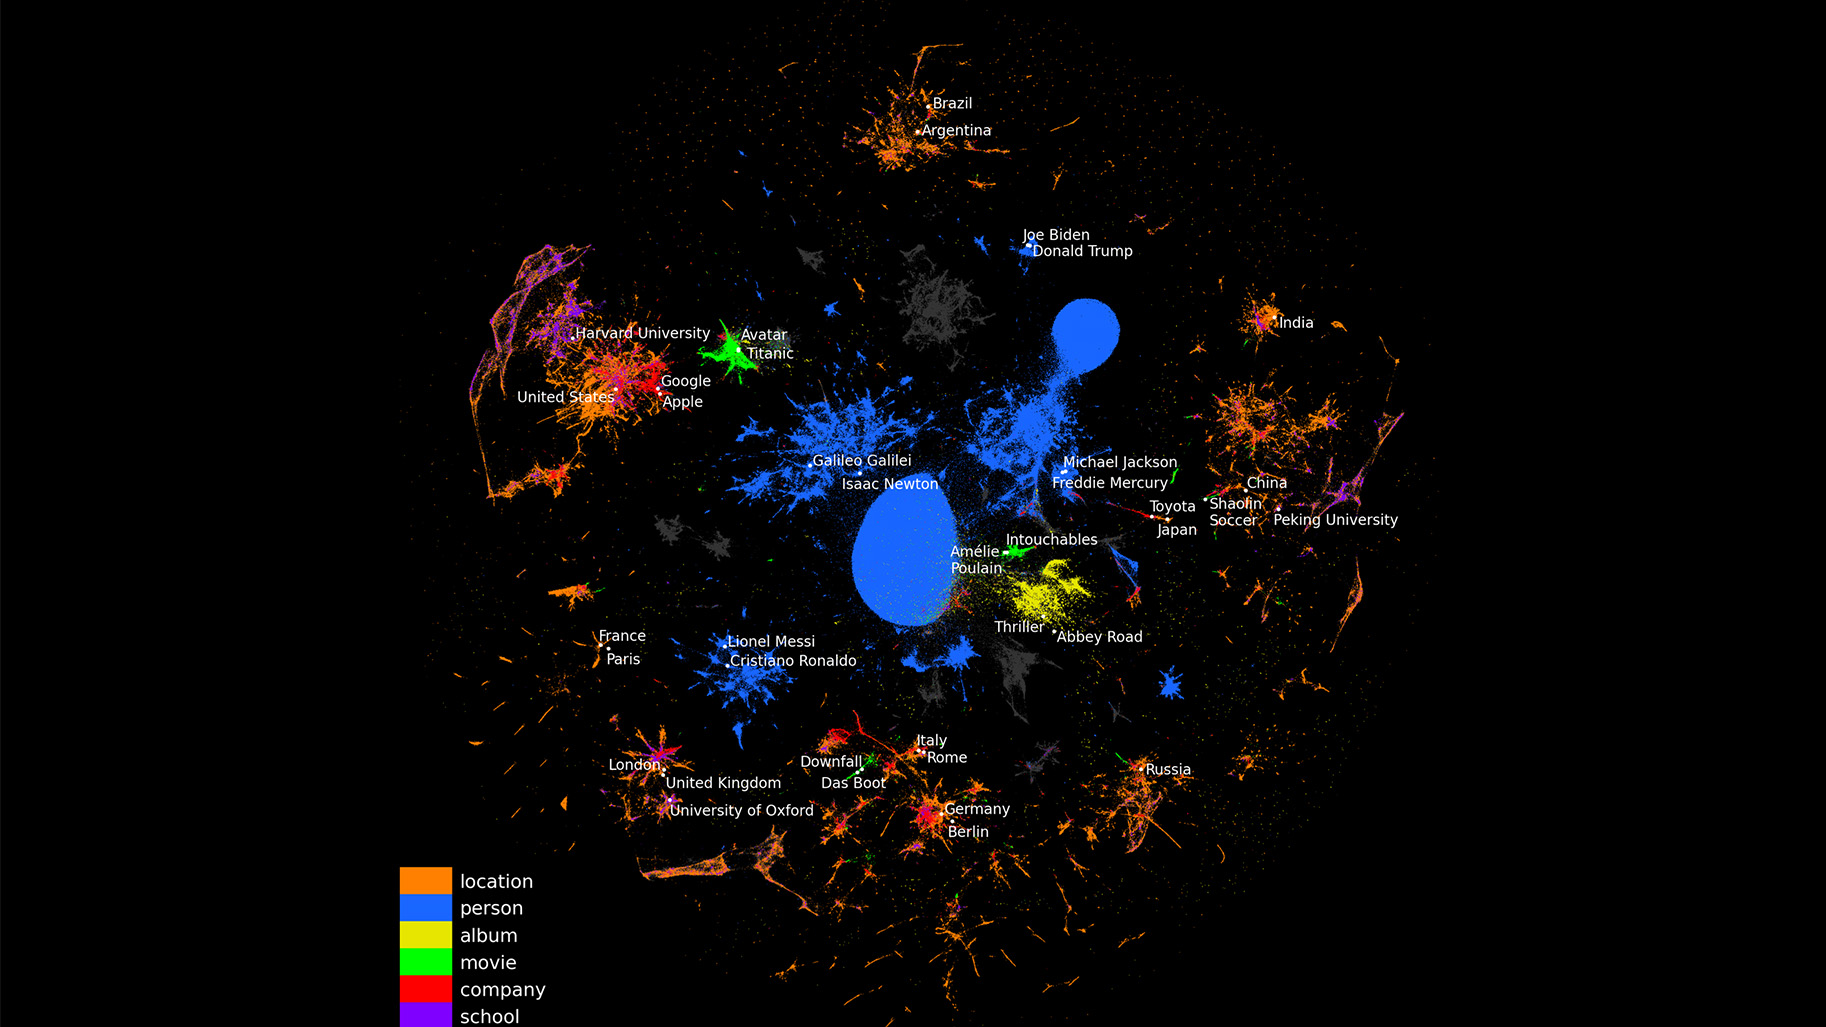
This part of the research featured in an article published in Machine Learning. The method has the capacity to represent extremely large data sets, and has been used by the scientists to vectorise part of the knowledge contained in Wikipedia. “These representations are now available to other analysts to download from our site.”
At the Inria Saclay centre, two postdoctoral researchers and one PhD student have been recruited to continue this research with Soda, a project team which stands at the intersection between machine learning, databases and their applications, particularly in the field of health. “There is a lot at stake in these fields, and in many others, given the vast quantities of data from large numbers of tables. This creates a lot of problems with unions and joins, which our methods will help to solve.”