Mathematical tools for modeling
Social networks: Can mathematical modeling help reduce polarization of opinions?
Date:

In 2019, Frank Valencia began working to apply his expertise in formal methods to social problems, in particular the growing role of social networks in the democratic process and the resulting polarization of opinions during elections, and around topics like the Covid 19 vaccine. “The dilemma of social networks is that, on the positive side, they have made the world more interconnected, with more access to information and opinion,” he says, “but on the negative side, they are able to shape users’ opinions on an unprecedented scale, leading to increased polarization. I wanted to find models to analyze that,” he continues, “and use my background in formal methods to adapt economic and statistical models that had already addressed similar problems.”

To develop this multi-disciplinary approach, Frank Valencia and his colleagues studied existing literature in economics and statistics on modeling social phenomena, such as polarization of communities due to economic factors. However, these do not account for the more recent appearance of social networks and the potentially infinite connections and opportunities for influence that they enable, through algorithms and engagement as well as human nature. “Humans are inherently irrational and are subject to cognitive bias,” says Frank Valencia. “Biases make people more vulnerable to manipulation and one of the key aims of our model is to express how beliefs are formed under cognitive biases.”
The researchers looked at three types of cognitive bias that inform the behavior of social network users:
“Intentionally or not, social networks may facilitate these biases,” says Frank Valencia. “Influencers form opinions among users through Authority Bias, Confirmation Bias leads to the creation of echo chambers that reinforce opinions, while Backfire Effect bias drives discussions that strengthen disagreement,” he explains. “Our model shows how these can in turn lead to the polarization that causes splits in society.”
The model takes a group of theoretical users and a proposition of interest, for example that vaccines are safe. It then takes the belief (opinion) of each user in this proposition and plots it on an influence graph where the belief of each user in the proposition is weighted from 1 = truly believes to 0 = truly does not believe. In this way, the model describes a user’s initial beliefs and how they may influence others. It also describes how beliefs are formed over time by adding a bias factor (see above). Over time, depending on the belief level of each user (from 1 to 0) and on which other user/s they influence or are influenced by, these beliefs will remain the same or evolve, and may or may not converge toward consensus.
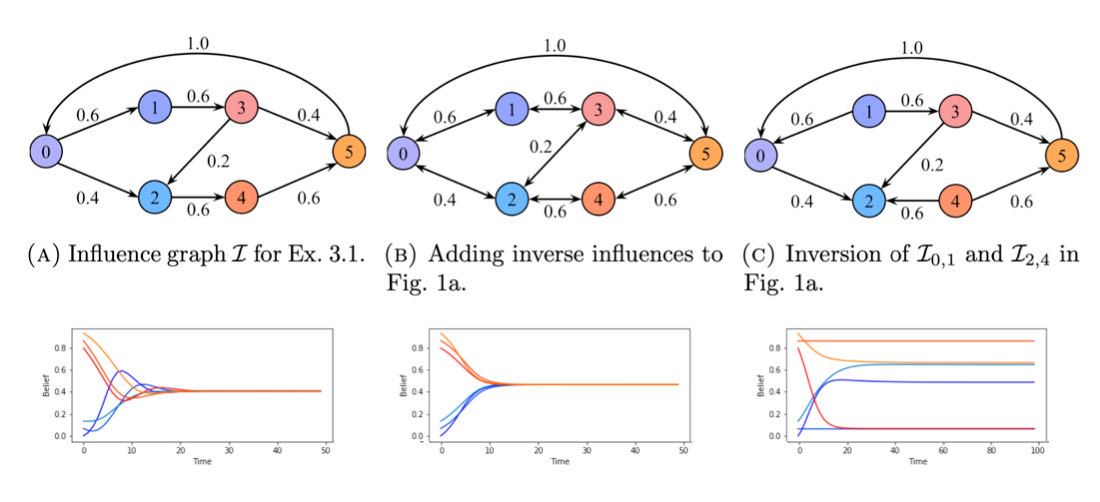
The graphs below illustrate how beliefs evolve under Confirmation Bias and different influence patterns: the upper graphs show the users and their level of belief, with red/orange shades representing users who believe or tend to believe that vaccines are safe and blue/purple shades representing those who do not or tend not to believe that vaccines are safe. The lower graphs show how each user’s belief evolves over time. In graph A, several users are initially attracted by user 5, who is pro-vaccine and highly influential. However, since user 5 is influenced by users 3 and 4, who are in turn influenced by anti-vaccine users, all opinions move around and finally reach consensus. In graph B, inverse influences have been added to those in graph A. Here, for example, user 5 influences users 3 and 4 as well as being influenced by them, while users 3 and 4 influence users 1 and 2 respectively, as well as being influenced by them, and so on. As a result, the converging trend begins sooner and consensus is reached more quickly. Finally, in graph C, users 1 and 4 continue to influence users 3 and 5 respectively, but are now no longer influenced by any other user and so do not change their beliefs. The users they influence evolve, but there can be no consensus.
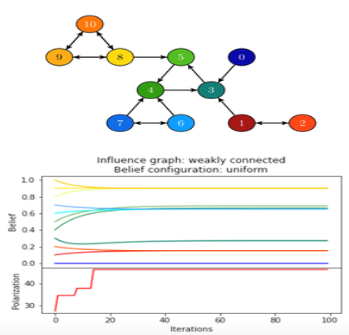
To study polarization, Frank Valencia’s research adapted the Esteban-Ray polarization measure, initially developed in economics (see above) to this belief model. It confirmed the intuition that polarization is accentuated when society can be divided into a small number of groups of significant size, especially when there is more similarity within a group and stronger differences between groups. And it gave an explanation for situations where these contrasting opinions persist (see graph below). “We established that in a community where polarization does not disappear over time, there is either a user that influences more than he or she is influenced, or there is an isolated or radical group in the community,” says Frank Valencia. “This gives us insight into real life, where there can be little or no possibility that a person or people in this position will change their mind.” In the diagram below, 0 (dark blue) represents a user with excessive influence, while 1 and 2 (dark and light red) and 8, 9 and 10 (yellow and orange) represent isolated or radical groups.
Going forward, the team aims to make their model more robust by adding dynamic influences that will bring it even closer to the way influences and beliefs change in reality. “Our research currently uses theoretical influencers, but we are also planning to verify our model by using real social network data,” concludes Frank Valencia, “Our results already show that social networks can be designed differently, using different algorithms, adjusted for bias, that will impact the flow of influence and so produce different results, with less polarization. We hope our work may be a step toward making that a reality.”